Header Logo
Home About Coaching Newsletter
Log In
← Back to all posts

Is a Stock Selloff Around the Corner?

Jul 08, 2025
Connect

The S&P 500 has been on a remarkable run lately—but cracks are starting to show beneath the surface.

Let’s break it down using SPY (the ETF that tracks the S&P 500) and some of our favorite technical indicators: RSI and Bollinger Bands.

SPY is currently trading near the upper band of its Bollinger Bands, a level that often signals overbought conditions and reduced upside potential. Historically, price touching or exceeding the upper band often leads to a short-term pullback.

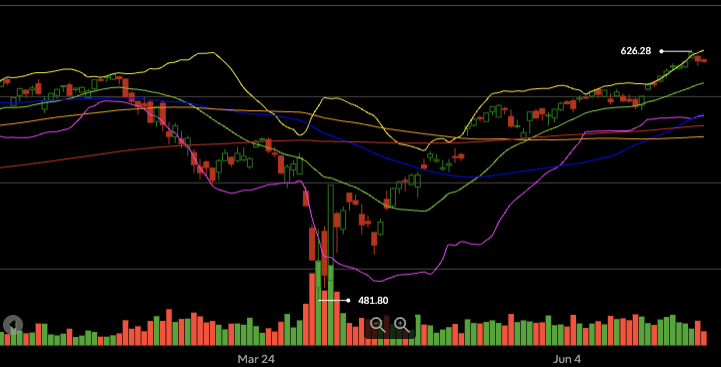
At the same time, the Relative Strength Index (RSI) for SPY is hovering around 70, a level that traditionally indicates an overbought market. When RSI crosses above this threshold, it means buying pressure has peaked—and sellers may be waiting to pounce.

Add in macroeconomic uncertainty,TARIFFS, interest rate speculation, and earnings season volatility, and we’ve got a perfect recipe for a market reset.

What to do next?

This could be a smart time to set some cash aside and prepare to take advantage of a potential pullback. If SPY and other high-quality stocks drop in the coming days or weeks, you'll be in a great position to sell cash-secured puts at lower prices—collecting premium while potentially entering long positions at a discount. It’s one of the most effective ways to turn volatility into opportunity.


Hope this helps!

Until next time...


Gautam

(Your Financial Freedom Coach)

Markets Turn Fearful: SPX Slips, Oil Jumps, and Why 12% Cash Matters Now
The S&P 500 (SPX) closed at 6,878.88 on February 27, falling roughly 0.5%–0.8% for the week and about 0.9% for the month, capping a volatile February with a second straight down session. The weakness was driven in part by post-earnings selling in Nvidia, as investors questioned the durability of AI-related capital spending despite strong results. At the same time, hotter-than-expected wholesale...
SPX Rebounds 1.1%, Tariff Ruling, Big Earnings Ahead + Free Trade Idea
Hey Traders, U.S. stocks moved higher for the week ending 2/20, with the S&P 500 gaining roughly 1.1% to close near 6,909, snapping its prior losing streak. The rebound was largely fueled by strong Q4 earnings, with about 75% of companies beating on the bottom line, helping restore confidence after recent weakness. Markets also caught a boost after the Supreme Court of the United States struck ...
Big Week Ahead: SPX Support \Test, Fed Minutes, Inflation Data
Hey Traders, The stock market experienced a broad-based decline for the trading week ending February 13, 2026, driven largely by growing concerns around the disruptive impact and stretched valuations tied to the AI trade. The week started strong, with the Dow Jones Industrial Average reaching a historic milestone — but momentum faded quickly as heavy selling in technology stocks dragged the bro...

Options for Financial Freedom Newsletter

Join Gautam’s free newsletter for trading tips, strategies, and ideas to help you retire early by building safe and consistent income.
Footer Logo
© 2026 OPTIONS FOR FINANCIAL FREEDOM
Powered by Kajabi

Join Our Free Trial

Get started today before this once in a lifetime opportunity expires.